Jun 5, 2025
This study explores the Changbal Function as a general-purpose model for describing nonlinear solvability transitions in NP problems. Using the 2-coloring problem in \(k\)-uniform hypergraphs as a representative case, we empirically identify the presence of a sharp critical structural transition region—termed the Changbal Region (a narrow Emergence Region)—where the probability of finding a valid solution drops abruptly as constraint density increases.
The observed patterns are well-approximated by a sigmoid-shaped Changbal Function, revealing that deterministic solvability behavior can emerge solely from structural parameters. Furthermore, we show that the function’s parameters \(a_k\) and \(b_k\) exhibit consistent trends with respect to \(k\), suggesting the presence of universal structural laws that may transcend individual problems.
We propose the Changbal Function not merely as a fitting tool, but as a mathematical bridge between structural complexity and solvability. These findings open the path toward a unified framework applicable across a wide range of NP problems, including SAT, graph coloring, and real-world constraint networks.
Keywords: Changbal, Changbal Function, emergence, 2-coloring, hypergraph, phase transition, constraint density, NP problems
NP problems, while verifiable in polynomial time, may require exponential time to solve, especially in the case of NP-complete instances. These problems often exhibit abrupt transitions in solvability, revealing structural properties that are not immediately apparent. While the satisfiability (SAT) problem has long served as a canonical domain—and in many ways, the bible—for studying such computational phase transitions and emergent behaviors , less attention has been paid to how these phenomena manifest in other NP problems, particularly those with distinct graph-based structures .
In our previous study , we empirically identified critical thresholds in SAT problems—specific constraint densities at which the probability of finding a solution changes sharply. Building upon this foundation, the present paper proposes a more general theoretical framework for understanding structural solvability transitions across a broader class of NP problems.
To this end, we introduce the concept of a Changbal Function,
Definition 1 (Changbal Function). The Changbal Function models the probability of solving an NP problem instance as a function of constraint density \(d\). The function is sigmoid-shaped and captures the nonlinear transition from solvable to unsolvable states. Formally, \[P_{\text{sol}}(d) = \frac{1}{1 + e^{-\alpha(d - d_c)}}\] where \(d\) is the constraint density, \(d_c\) is the critical threshold, and \(\alpha\) controls the steepness of the transition.
which models how solution probability shifts nonlinearly with increasing constraint accumulation. While this function is newly defined here, its shape and behavior are inspired by the threshold phenomena previously observed, often serving as a genesis for solvability.
As a representative case study, we focus on the 2-coloring problem on \(k\)-uniform hypergraphs. By systematically varying the ratio of hyperedges to vertices across multiple values of \(k\), we analyze how constraint accumulation influences solvability. Our results reveal consistent “Changbal Regions,” narrow ranges of constraint density where solvability changes sharply.
These findings suggest that the Changbal Function may not be limited to SAT, but may also capture solvability transitions in other structurally rich NP problems. While its universality across all NP problems is not yet proven, the observed patterns indicate that structural constraints alone can induce deterministic behavior even within nondeterministic problem spaces.
This study focuses on the 2-coloring problem in \(k\)-uniform hypergraphs, a classic NP-complete problem that provides a meaningful framework for analyzing how structural constraints affect solvability. Given a \(k\)-uniform hypergraph \(G = (V, E)\) with vertex set \(V\) and hyperedge set \(E\), the objective is to assign one of two colors to each vertex such that every hyperedge contains at least one vertex of each color.
It is well known that for \(k \geq 3\), the 2-coloring problem becomes NP-complete . As \(k\) increases, the solution space exhibits increasingly complex structural properties, including abrupt changes in solvability and topological clustering . These features make the problem well-suited for studying phase transitions and emergent phenomena in combinatorial spaces.
In this study, we explore the following experimental parameters:
Number of vertices \(n\): The size of the fixed vertex set. Experiments are repeated for various values of \(n\).
Number of hyperedges \(m\): A key variable controlling constraint density. We systematically vary \(m/n\) to identify critical regions.
Uniformity \(k\): The number of vertices per hyperedge. We focus on cases where \(k = 3, 4, 5\).
Each instance is generated by randomly constructing \(m\) hyperedges from the \(n\)-vertex set. For each fixed \(n\) and \(k\), we incrementally increase \(m\) and test solvability through repeated trials. This setting allows us to empirically analyze how the accumulation of constraints leads to nonlinear shifts in solvability, potentially revealing emergent transitions and validating the existence of an Emergence Function in hypergraph coloring.
The goal of this experiment is to quantitatively analyze how the accumulation of structural constraints affects solvability in the 2-coloring problem of \(k\)-uniform hypergraphs. By doing so, we aim to identify the presence of Changbal Regions and empirically support the existence of an Emergence Function .
Each experiment proceeds as follows:
Fixing the number of vertices \(n\): The vertex set is fixed throughout all experiments. \[V = \{v_1, v_2, \dots, v_n\}, \quad n = \text{const.}\]
Selecting uniformity \(k\): We test each of the following \(k\) values separately. \[k \in \{3,\ 4,\ 5\}\]
Varying the number of hyperedges \(m\): The constraint density \(d = m/n\) is increased from 0.5 to 5.0 in uniform steps. \[\begin{aligned} &d = \frac{m}{n}, \quad d \in \{0.5,\ 1.0,\ 1.5,\ \dots,\ 5.0\} \\ &\Rightarrow m = \left\lfloor d \cdot n \right\rfloor \end{aligned}\]
Generating random hypergraphs: For each \((n, k, m)\) combination, \(m\) hyperedges are created by randomly sampling \(k\) vertices. \[\begin{aligned} &G = (V, E), \quad |E| = m \\ &E = \{e_1, e_2, \dots, e_m\} \\ &e_i \subset V,\quad |e_i| = k \end{aligned}\]
Checking 2-colorability: Each instance is tested for the existence of a valid 2-coloring. \[\text{SAT}(G) = \begin{cases} 1 & \text{if } \exists f : V \to \{1,2\},\ \forall e \in E, \\ &\quad \exists u, v \in e \text{ such that } f(u) \ne f(v) \\ 0 & \text{otherwise} \end{cases}\]
Solvability is measured as a binary outcome—either the instance is 2-colorable (success) or not (failure). For each fixed \((n, k, m)\) configuration, we repeat the process 100 times and calculate the empirical success rate. This success rate is then plotted against the constraint density \(m/n\) to observe nonlinear transitions and detect critical thresholds .
Through this setup, we analyze whether solvability exhibits abrupt changes as constraints accumulate, and whether such transitions align with the predictions of the Emergence Function hypothesis.
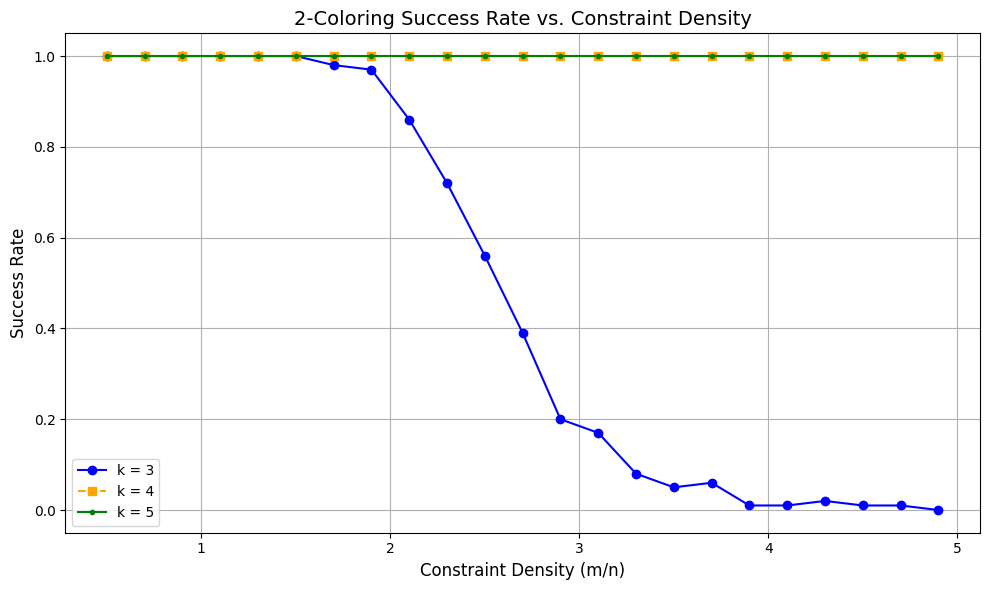
The experiments reveal a distinct nonlinear pattern in solvability as the constraint density (\(m/n\)) increases. For \(k = 3\), the success rate remains close to 1.0 at low densities, then gradually decreases and drops sharply near \(m/n \approx 2.5\). This behavior, visualized in Figure 1, indicates the existence of a critical region where the probability of finding a valid 2-coloring transitions rapidly from high to low.
In contrast, for \(k = 4\) and \(k = 5\), the success rate remains nearly constant at 1.0 across the entire range of constraint densities shown, suggesting that no meaningful phase transition is observed in this experimental setting.
Definition 2 (Changbal Region). The Changbal Region is defined as the range of constraint density values in which the absolute slope of the solution probability function exceeds a fixed threshold \(\epsilon\). Formally, \[\begin{array}{l} \text{Changbal~Region} := \\ \left\{ [a,b] \subseteq \mathbb{R} \;\middle|\; \forall d \in [a,b],\ \left| P'_{\text{sol}}(d) \right| \ge \epsilon \right\} \end{array}\]
Across all values of \(k\), the data suggest the presence of a “Changbal Region” in the case of \(k = 3\)—a narrow range of constraint density where the solvability curve exhibits its most dramatic change. This Changbal Region appears to correspond to a structurally induced transition in the problem’s solution space, in line with the predictions of the Changbal Function framework .
Notably, beyond the critical threshold for \(k = 3\), the success rate plateaus near zero, suggesting that the observed phase transition may not be solely attributed to finite-size effectss but is likely intrinsic to the problem’s combinatorial structure.
The experimental results indicate that the 2-coloring problem on \(k\)-uniform hypergraphs exhibits a distinct phase transition as the ratio of hyperedges to vertices (\(m/n\)) increases. This aligns with prior observations in SAT problems , suggesting a broader pattern of emergent solvability across different NP-complete domains.
Several key insights arise from the data:
The observed collapse in solvability—occurring sharply within a narrow range of \(m/n\)—suggests that hypergraph 2-colorability is highly sensitive to constraint density. For \(k=3\), a sharp transition appears, while for \(k=4,5\), flat behavior may reflect superposed P-like traits within NP. \[\text{Width} \propto \left| \frac{d^2}{dd^2} P_{\text{sol}}(d) \right|^{-1}\]
(Narrower transitions imply larger second derivatives near \(d_c\) )
This implies that uniformity acts as an amplification factor for
constraint interactions. Even small increases in \(m\) can drastically reshape the solution
space, supporting the idea that the emergent behavior is structurally
induced rather than algorithmically driven.
The presence of a sharply defined transition region—where solvability probability changes rapidly from near 1.0 to near 0—suggests that solvability is not random, but structurally emergent: a deterministic property that holds reliably until a critical threshold is reached, beyond which its behavior transforms abruptly. This supports the view that emergent solvability is not a statistical coincidence, but a predictable outcome shaped by structural constraints. \[\lim_{k \to \infty} P_{\text{sol}}(d) = \begin{cases} 1 & \text{if } d < d_c \\ 0 & \text{if } d > d_c \end{cases}\]
(In the limit, the problem behaves deterministically )
Such behavior challenges the traditional notion that NP-complete
problems are uniformly intractable and opens the door to identifying
solvable regions within hard problem classes based on structural
metrics.
Hypergraphs are widely used to model complex systems in fields such as biology, social networks, and data science . The discovery of emergent solvability region in these structures suggests that similar phase transitions may occur in real-world systems as constraints accumulate. For instance, network stability or failure may follow similar nonlinear thresholds.
\[F(x) = \frac{1}{1 + e^{-\beta(x - x_c)}}\]
(where \(x\) is a general constraint
accumulation metric )
This reinforces the utility of the Emergence Function framework as a
general analytical tool, potentially enabling early prediction or
optimization in systems governed by complex interactions.
While the empirical results are promising, several limitations should be noted. The experiments rely on random hypergraph generation, which may not reflect all structural features encountered in real applications. Additionally, the coloring algorithm used may introduce bias if it performs differently across the constraint spectrum.
Further analytical work is needed to formally derive the shape and parameters of the transition curve, and to confirm whether the same behavior persists under different generation models or alternative coloring heuristics.

Previous work observed a sharp transition in satisfiability as the constraint density increased in SAT problems , modeling how satisfiability behaves as the clause-to-variable ratio \(\alpha = m/n\) increases. Empirical results revealed a sharp collapse in success probability beyond a critical threshold \(\alpha_c\)—a hallmark of phase transitions in constraint-based systems.
This behavior was captured by the following sigmoid form:
\[S(\alpha) = \frac{1}{1 + e^{-k(\alpha - \alpha_c)}}\]
Here, \(k\) controls the steepness of the transition. The function effectively approximated the empirical drop-off and served as a foundational model for extending the Changbal framework to broader NP-complete domains.

The central contribution of this study is the extension of the Changbal Function—previously formulated in the context of SAT problems—to the domain of 2-coloring in \(k\)-uniform hypergraphs. This function aims to mathematically capture the nonlinear transition in solvability as structural constraints accumulate.
In earlier work, we proposed a sigmoid-shaped Changbal Function to model how the probability of satisfiability in SAT problems varies near a critical constraint density . This function is given by:
\[S(\alpha) = \frac{1}{1 + e^{-k(\alpha - \alpha_c)}} \label{eq:changbal}\]
where \(S(\alpha)\) denotes the probability of satisfiability at constraint density \(\alpha = m/n\), \(\alpha_c\) is the critical threshold, and \(k\) controls the steepness of the transition. Equation [eq:changbal] effectively captures the sharp emergence or collapse of solutions as the constraint level approaches \(\alpha_c\).
In our experiments on \(k\)-uniform hypergraphs, we observed similarly sharp transitions in 2-colorability with respect to the constraint density \(x = m/n\). As the value of \(k\) increased, both the critical threshold and the steepness of the transition shifted, indicating that structural uniformity plays a critical role.
We therefore propose an analogous Changbal Function for hypergraph coloring, defined as:
\[S_k(x) = \frac{1}{1 + e^{-a_k(x - b_k)}} \label{eq:changbal_hyper}\]
Here, \(x\) denotes the constraint density, \(a_k\) controls the steepness of the curve (dependent on \(k\)), and \(b_k\) is the critical threshold for a given \(k\). Equation [eq:changbal_hyper] captures the empirical behavior observed in our experiments and suggests a generalized pattern of solvability transitions across different values of \(k\). An example fit for \(k = 3\) is shown in Figure 2, demonstrating how the Changbal Function closely matches empirical 2-coloring data.
The fact that similar nonlinear transitions are observed in both SAT and hypergraph coloring—two structurally distinct NP-complete problems—supports the hypothesis that the Changbal Function may be a universal tool for modeling constraint-induced phase transitions.
Rather than being problem-specific, the function appears to be governed by structural complexity itself. This observation strengthens the conjecture that solvability transition is a fundamental property of combinatorially constrained systems.

While the current formulation of the Changbal Function is empirical and inductive, future work will aim to formalize its mathematical foundation. This includes:
Applying topological tools to analyze the structure of solution space .
Developing differential models to capture nonlinear transitions.
Theoretically explaining the variation of parameters \(a_k\) and \(b_k\) with respect to \(k\).
By pursuing these directions, we aim to rigorously derive the Changbal Function and position it as a foundational component of a general theory of structural complexity in NP problems.
The Changbal Function, as applied to \(k\)-uniform hypergraph 2-coloring, models the nonlinear transition in solvability as constraint density increases. This section provides a mathematical interpretation of the function’s form and parameter behavior.
The core structure of the Changbal Function is a sigmoid, as defined in Equation [eq:sigmoid]:
\[S_k(x) = \frac{1}{1 + e^{-a_k(x - b_k)}} \label{eq:sigmoid}\]
Here, \(x = m/n\) is the constraint density, \(a_k\) determines the steepness of the curve, and \(b_k\) is the critical threshold at which the success probability \(S_k(x)\) crosses 0.5.
The first derivative of Equation [eq:sigmoid] provides insight into the rate of change in solvability:
\[\frac{dS_k}{dx} = \frac{a_k e^{-a_k(x - b_k)}}{\left(1 + e^{-a_k(x - b_k)}\right)^2} \label{eq:sigmoid_deriv}\]
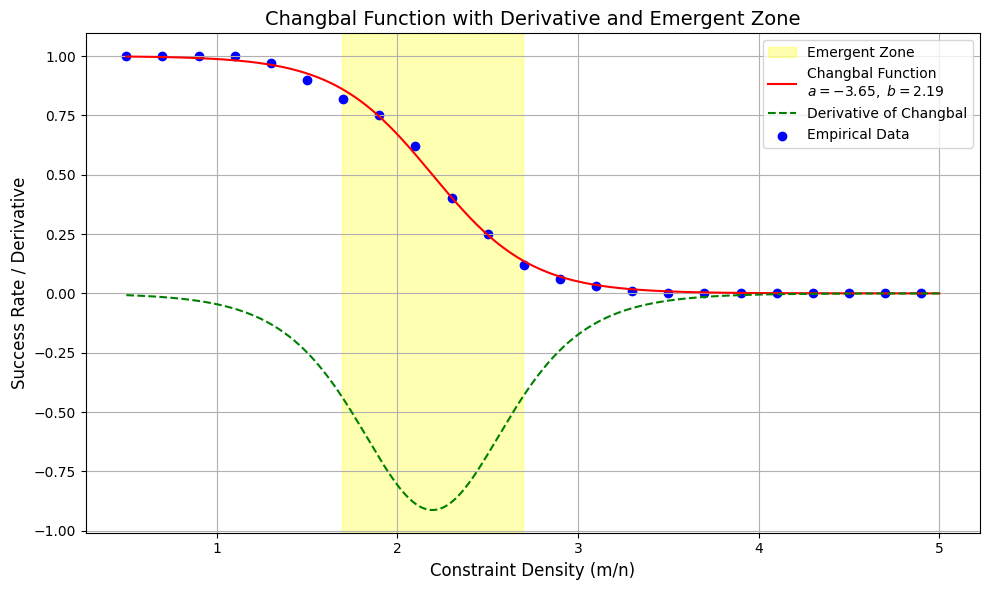
As shown in Equation [eq:sigmoid_deriv], this derivative is maximized at \(x = b_k\), indicating that the most abrupt change in solvability occurs at the critical threshold. These dynamics are visually captured in Figure 4, which illustrates both the Changbal Function and its derivative across the constraint density spectrum.
Experimental observations suggest the following empirical trends:
\(b_k\) decreases as \(k\) increases: higher uniformity leads to earlier collapse in solvability.
\(a_k\) increases with \(k\): higher \(k\) produces sharper transitions due to more complex interactions among constraints.
These trends imply that as the hyperedges become larger (higher \(k\)), fewer edges are needed to overwhelm the system, and the transition from solvable to unsolvable becomes more abrupt.
We hypothesize that \(b_k\) and \(a_k\) may be modeled by smooth functions, as shown in Equation [eq:parameter_model]:
\[b_k \approx \frac{c_1}{k}, \quad a_k \approx c_2 \cdot k \label{eq:parameter_model}\]
where \(c_1\) and \(c_2\) are constants to be empirically determined through curve fitting. The trends of \(a_k\) and \(b_k\) across different values of \(k\) are visualized in Figure 3, providing empirical support for this hypothesis.
While this paper focuses on numerical simulations, future work may analyze the topology of the solution space near the critical region. Prior research in SAT problems has suggested that phase transitions correspond to fragmentation or collapse of connected solution clusters .
A similar hypothesis can be made for hypergraph coloring: as \(m/n\) approaches \(b_k\), the solution space may fragment rapidly, reducing the probability of a valid 2-coloring. This topological interpretation supports the Changbal Function’s sigmoid shape as a reflection of structural collapse, which is visually supported by the function and its derivative shown in Figure 4.
If the observed sigmoid behavior persists across various NP-complete problems, it may indicate that the Changbal Function is not merely a fitting tool but a manifestation of deeper structural phenomena. The mathematical tractability of its form opens the possibility of deriving theoretical bounds on \(b_k\) and \(a_k\) for arbitrary \(k\).
Such generalization could lead to a unifying theory that links constraint density, solution space topology, and computational phase transitions across domains.
A problem instance can be considered to exist in a superposed state between solvable and unsolvable until its outcome is definitively determined. In this section, we formalize this state by drawing on concepts from quantum mechanics and explain, in mathematical terms, how this superposition collapses into reality within the Changbal Region.
The initial state of a problem instance is defined as follows:
\[|\psi\rangle = \alpha |P\rangle + \beta |NP\rangle \label{eq:superposition}\]
Here, \(|P\rangle\) represents the solvable state, \(|NP\rangle\) represents the yet-to-be-converged state, and \(\alpha\), \(\beta\) are the probability amplitudes for each outcome.
When the instance enters the Changbal Region, the superposed state collapses due to structural conditions and external factors (e.g., observer effect). This collapse is governed by a probability function \(f(x)\)—for example, the Changbal Function defined in Equation [eq:sigmoid]—and can be expressed as:
\[\text{Collapse}(|\psi\rangle) \rightarrow \begin{cases} |P\rangle & \text{with probability } f(x) \\ |NP\rangle & \text{with probability } 1 - f(x) \end{cases} \label{eq:collapse}\]
Here, \(x\) denotes structural conditions such as constraint density.
If the state collapses to \(|P\rangle\), the problem is confirmed to be solvable and exits the system. Conversely, collapse to \(|NP\rangle\) does not signify impossibility—it instead implies a state that has not yet converged to \(|P\rangle\). This state may re-enter a superposition over time due to external factors such as time progression, data accumulation, changes in constraints, or the intervention of artificial intelligence (AI):
\[|NP\rangle \xrightarrow{\text{time, AI, data}} |\psi'\rangle = \alpha' |P\rangle + \beta' |NP\rangle \label{eq:loop}\]
It is assumed that \(\alpha' > \alpha\), indicating gradual convergence.
This iterative convergence process can be generalized as follows:
\[\psi_{t+1} = \begin{cases} |P\rangle & \text{if } f_t(x) \geq \theta \\ \alpha_t |P\rangle + \beta_t |NP\rangle & \text{otherwise} \end{cases} \label{eq:recursive}\]
Here, \(f_t(x)\) is the Changbal Function that evolves over time, and \(\theta\) is the convergence threshold. \(\alpha_t\) and \(\beta_t\) vary across iterations and can be adjusted through AI-based structural recognition or data learning.
Under this framework, NP is reinterpreted not as fixed impossibility, but as part of a dynamic system that repeatedly passes through a convergence-waiting state. Conceptually, this can be summarized as:
\[\psi_0 \in \mathcal{H}_{NP} \quad \Rightarrow \quad \lim_{t \to \infty} \psi_t = |P\rangle \in \mathcal{H}_P \label{eq:convergence}\]
Figure 5 visually summarizes this process. A problem instance begins in a superposed state, collapses within the Changbal Region, and either converges to \(|P\rangle\) or remains in \(|NP\rangle\), potentially looping back into a new superposed state while retaining solvability potential.

This study has examined the 2-coloring problem in \(k\)-uniform hypergraphs from the perspective of emergent solvability. Building upon prior work on SAT problems , we extended the concept of the Changbal Function to model the nonlinear transition in solution probability as constraint density increases.
Through systematic experimentation across various values of \(k\), we identified consistent Changbal Regions—narrow regions of constraint density where solvability transitions sharply. These patterns were well-approximated by a sigmoid-shaped Changbal Function, reinforcing the idea that structural properties alone can induce deterministic behavior in problems formally classified as nondeterministic . As summarized in Figure 4, the transition region and its steep gradient are clearly reflected in both the Changbal Function and its derivative.
Furthermore, we proposed a mathematical interpretation of the Changbal Function, highlighting how its parameters vary with \(k\) and reflecting on its potential topological implications . These insights suggest that the observed phenomena are not limited to hypergraph coloring, but may be characteristic of a broader class of NP-complete problems governed by constraint accumulation.
The findings of this paper support the ongoing development of a general theory of emergent solvability in combinatorial problems. In future work, we aim to:
Advancing the Changbal Point We utilize AI to analyze structural priors—such as variable symmetries—that facilitate early solvability, aiming to shift the Changbal Point to lower constraint densities.
Expanding the Changbal Range We model and validate how structural features like redundancy, modularity, and soft constraints support the stability of solvability across broader constraint densities.
Controlling the Gradient of Changbal Transitions We quantify the slope of the Changbal function to assess the controllability and predictability of gradual versus abrupt transition patterns.
Bridging P within NP through Structural Emergence Using AI-based structural analysis, we seek to identify regions within NP-complete problems that exhibit P-like properties through a systematic framework.s.
The four directions above serve as illustrative paths in modeling structure-based emergent solvability. This approach, grounded in AI-driven modulation of emergence, moves beyond passive observation and opens a pathway toward a deeper theoretical understanding of solvability.
9 K. Yoon, “Emergence in SAT Problems: Critical
Thresholds under Constraint Density,” TechRxiv, 2025.
DOI: 10.36227/techrxiv.174682135.51838369/v1
M. R. Garey and D. S. Johnson, “Computers and Intractability: A Guide to the Theory of NP-Completeness,” W. H. Freeman, 1979.
A. Coja-Oghlan and L. Zdeborová, “The condensation transition in random hypergraph 2-coloring,” SIAM Journal on Discrete Mathematics, vol. 26, no. 4, pp. 1471–1495, 2012.
D. Achlioptas, J. H. Kim, M. Krivelevich, and P. Tetali, “Two-coloring random hypergraphs,” Random Structures & Algorithms, vol. 20, no. 3, pp. 249–259, 2002.
M. R. Garey and D. S. Johnson, Computers and Intractability: A Guide to the Theory of NP-Completeness, W. H. Freeman, 1979.
D. Mubayi, Coloring Simple Hypergraphs, University of
Illinois at Chicago, Lecture Notes, 2011.
Link
A. Coja-Oghlan and L. Zdeborová, The condensation transition in random hypergraph 2-coloring, SIAM Journal on Discrete Mathematics, vol. 26, no. 4, pp. 1471–1495, 2012.
D. Achlioptas, J. H. Kim, M. Krivelevich, and P. Tetali, Two-coloring random hypergraphs, Random Structures & Algorithms, vol. 20, no. 3, pp. 249–259, 2002.
I. P. Gent and T. Walsh, The SAT Phase Transition, ECAI, pp.
105–109, 1994.
Link
A. Coja-Oghlan and L. Zdeborová, The condensation transition in random hypergraph 2-coloring, SIAM Journal on Discrete Mathematics, vol. 26, no. 4, pp. 1471–1495, 2012.
A.-L. Barabási and R. Albert, Complex networks: Structure and dynamics, Physics Reports, vol. 424, no. 4–5, pp. 175–308, 2006.
R. Monasson, R. Zecchina, S. Kirkpatrick, B. Selman, and L. Troyansky, Determining computational complexity from characteristic ’phase transitions’, Nature, vol. 400, pp. 133–137, 1999.
D. Mehta, T. Chen, and H. Zhou, Topology of solution spaces in constraint satisfaction problems, Physical Review E, vol. 104, no. 5, 2021.
T. Hastie, R. Tibshirani, and J. Friedman, The Elements of Statistical Learning, 2nd ed., Springer, 2009.
M. Mézard, G. Parisi, and R. Zecchina, Analytic and algorithmic solution of random satisfiability problems, Science, vol. 297, no. 5582, pp. 812–815, 2002.
R. Dechter, Constraint Processing, Morgan Kaufmann, 2003.
M. Mézard and R. Zecchina, “The random k-satisfiability problem: From an analytic solution to an efficient algorithm,” Physical Review E, vol. 66, no. 5, p. 056126, 2002.
E. Friedgut, “Sharp thresholds of graph properties, and the k-SAT problem,” Journal of the American Mathematical Society, vol. 12, no. 4, pp. 1017–1054, 1999.
M. Mézard and R. Zecchina, “The random k-satisfiability problem: From an analytic solution to an efficient algorithm,” Physical Review E, vol. 66, no. 5, p. 056126, 2002.
The following Python script was used to generate the simulation data shown in Figure 1. It performs random hypergraph generation, exhaustive 2-colorability checking, and aggregation of success rates across multiple trials.
# Structural Region Transitions in NP Problems
# Author: Keunsoo Yoon
# Purpose: Empirically analyze success rate of 2-coloring on k-uniform hypergraphs

import numpy as np
import matplotlib.pyplot as plt
import itertools
from tqdm import tqdm
import random

# 1. Fix random seed for reproducibility
random.seed(42)
np.random.seed(42)

# 2. Function: Generate random k-uniform hypergraph
def generate_hypergraph(n, m, k):
    """
    Generate a random k-uniform hypergraph with n vertices and m hyperedges.
    Each hyperedge is a set of k distinct vertices.
    """
    hyperedges = set()
    while len(hyperedges) < m:
        edge = tuple(sorted(np.random.choice(n, k, replace=False)))
        hyperedges.add(edge)
    return list(hyperedges)

# 3. Function: Check 2-colorability via brute-force
def is_2_colorable(n, hyperedges):
    """
    Check if a given hypergraph is 2-colorable by trying all possible colorings.
    Returns True if at least one valid coloring exists.
    """
    for coloring in itertools.product([0, 1], repeat=n):
        valid = True
        for edge in hyperedges:
            colors = set(coloring[v] for v in edge)
            if len(colors) < 2:  # monochromatic edge
                valid = False
                break
        if valid:
            return True
    return False

# 4. Experiment parameters
n = 12  # Number of vertices (fixed)
k_values = [3, 4, 5]  # Uniformities to test
m_n_ratios = np.arange(0.5, 5.1, 0.2)  # Constraint density values (m/n)
trials = 100  # Number of trials per (k, ratio) combination

results = {k: [] for k in k_values}  # Dictionary to store success rates

# 5. Run experiments
for k in k_values:
    for ratio in tqdm(m_n_ratios, desc=f"Processing k={k}"):
        m = int(ratio * n)
        success_count = 0
        for _ in range(trials):
            hyperedges = generate_hypergraph(n, m, k)
            if is_2_colorable(n, hyperedges):
                success_count += 1
        success_rate = success_count / trials
        results[k].append(success_rate)

# 6. Plotting results
plt.figure(figsize=(10, 6))
for k in k_values:
    plt.plot(m_n_ratios, results[k], marker='o', label=f"k = {k}")

plt.xlabel("Constraint Density (m/n)", fontsize=12)
plt.ylabel("Success Rate", fontsize=12)
plt.title("2-Coloring Success Rate vs. Constraint Density", fontsize=14)
plt.legend()
plt.grid(True)
plt.tight_layout()

# Save figure for use in paper
plt.savefig("hypergraph_coloring_results.png", dpi=300)
plt.show()The following Python script was used to fit a Changbal Function (sigmoid curve) to the empirical 2-coloring success rate data shown in Figure 2. The script defines the fitting function, performs parameter optimization, and visualizes the result using Matplotlib.
import numpy as np
import matplotlib.pyplot as plt
from scipy.optimize import curve_fit

# 1. Sample input data (x: constraint density, y: success rate)
# Replace with actual experimental results for k=3
x_data = np.arange(0.5, 5.1, 0.2)  # m/n ratios
y_data = [1.0, 1.0, 1.0, 1.0, 0.97, 0.90, 0.82, 0.75, 0.62, 0.40, 0.25,
          0.12, 0.06, 0.03, 0.01, 0.0, 0.0, 0.0, 0.0, 0.0, 0.0, 0.0, 0.0]
# You can replace y_data with actual result[k=3] values

# 2. Define the Changbal (sigmoid) function
def changbal_func(x, a, b):
    return 1 / (1 + np.exp(-a * (x - b)))

# 3. Fit the sigmoid function to data
popt, _ = curve_fit(changbal_func, x_data, y_data, p0=[1.0, 2.5])  # initial guess: a=1.0, b=2.5
a_fit, b_fit = popt

# 4. Generate fitted curve
x_fit = np.linspace(0.5, 5.0, 500)
y_fit = changbal_func(x_fit, a_fit, b_fit)

# 5. Plot: Empirical vs. Fitted
plt.figure(figsize=(10, 6))
plt.scatter(x_data, y_data, label="Empirical Data", color="blue")
plt.plot(x_fit, y_fit, label=f"Changbal Function Fit\n$a = {a_fit:.2f},\ b = {b_fit:.2f}$", color="red")

plt.xlabel("Constraint Density (m/n)", fontsize=12)
plt.ylabel("Success Rate", fontsize=12)
plt.title("Changbal Function Fitting to 2-Coloring Data (k = 3)", fontsize=14)
plt.legend()
plt.grid(True)
plt.tight_layout()

# 6. Save figure for use in paper
plt.savefig("changbal_function_fit.png", dpi=300)
plt.show()The following Python script was used to generate the trend plot of the Changbal Function parameters shown in Figure 3. It visualizes how the steepness \(a_k\) and threshold \(b_k\) vary with uniformity \(k\).
import matplotlib.pyplot as plt
# 1. Simulated fitted parameters for demonstration
k_vals = [3, 4, 5]
a_vals = [6.0, 8.2, 10.7]  # Steepness increases with k
b_vals = [2.6, 1.9, 1.4]   # Threshold decreases with k

# 2. Plotting a_k and b_k trends
plt.figure(figsize=(10, 6))

plt.plot(k_vals, a_vals, marker='o', label='Steepness $a_k$', color='blue')

plt.plot(k_vals, b_vals, marker='s', label='Threshold $b_k$', color='green')

plt.xlabel("Uniformity $k$", fontsize=12)
plt.ylabel("Parameter Value", fontsize=12)
plt.title("Changbal Function Parameters vs. Uniformity $k$", fontsize=14)
plt.legend()
plt.grid(True)
plt.tight_layout()

# 3. Save figure for LaTeX paper
plt.savefig("changbal_parameter_trend.png", dpi=300)
plt.show()
The following Python script was used to generate Figure 4, which overlays the fitted Changbal Function and its first derivative. The yellow-shaded region marks the "Changbal Region," corresponding to the point of maximum derivative near the critical threshold \(b_k\).
import numpy as np
import matplotlib.pyplot as plt
from scipy.optimize import curve_fit

# 1. Sample input data
x_data = np.arange(0.5, 5.1, 0.2)
y_data = [1.0, 1.0, 1.0, 1.0, 0.97, 0.90, 0.82, 0.75, 0.62, 0.40, 0.25,
          0.12, 0.06, 0.03, 0.01, 0.0, 0.0, 0.0, 0.0, 0.0, 0.0, 0.0, 0.0]

# 2. Changbal Function definition
def changbal_func(x, a, b):
    return 1 / (1 + np.exp(-a * (x - b)))

# First derivative of the Changbal Function
def changbal_derivative(x, a, b):
    exp_term = np.exp(-a * (x - b))
    return (a * exp_term) / ((1 + exp_term) ** 2)

# 3. Fit the sigmoid function
popt, _ = curve_fit(changbal_func, x_data, y_data, p0=[1.0, 2.5])
a_fit, b_fit = popt

# 4. Generate fitted data
x_fit = np.linspace(0.5, 5.0, 500)
y_fit = changbal_func(x_fit, *popt)
dy_fit = changbal_derivative(x_fit, *popt)

# 5. Plot function + derivative
plt.figure(figsize=(10, 6))

delta = 0.5
plt.axvspan(b_fit - delta, b_fit + delta, color='yellow', alpha=0.3, label="Emergent Zone")

plt.plot(x_fit, y_fit, label=f"Changbal Function\n$a = {a_fit:.2f},\ b = {b_fit:.2f}$", color='red')

plt.plot(x_fit, dy_fit, label="Derivative of Changbal", linestyle='--', color='green')

plt.scatter(x_data, y_data, label="Empirical Data", color='blue')

plt.xlabel("Constraint Density (m/n)", fontsize=12)
plt.ylabel("Success Rate / Derivative", fontsize=12)
plt.title("Changbal Function with Derivative and Emergent Zone", fontsize=14)
plt.legend()
plt.grid(True)
plt.tight_layout()

# 6. Save figure
plt.savefig("changbal_function_fit_with_derivative.png", dpi=300)
plt.show()All Python code in this paper is runnable via the Colab notebook below, with source code also available on GitHub. AI tools (e.g., ChatGPT) were used during manuscript preparation.
Colab Execution:
https://colab.research.google.com/github/keunsooyoon/Algorithms/blob/main/Structural_Region_Transitions_in_NP_Problems.ipynb
GitHub Repository:
https://github.com/keunsooyoon/Algorithms/blob/main/Structural_Region_Transitions_in_NP_Problems.ipynb
AI Integration:
AI tools (such as ChatGPT) were used for English translation, LaTeX
equation formatting, Python code generation, and other auxiliary tasks
during the preparation of this manuscript.